
Reports and Data
On this page you can find an overview of publically available reports, a map indicating all countries which have engaged in a SAI PMF assessment, and key figures from the SAI PMF initiative
Published Reports
The following SAI PMF reports are published and publically available.
Country | Year | Version | Language | Assessment details | Download |
|---|---|---|---|---|---|
Albania | 2022 | 2022-2016 version | English | ||
Aruba | 2021 | 2016 version | English | ||
Bhutan | 2015 | Pilot version | English | ||
Bhutan | 2021 | 2016 version | English | Repeat assessment | |
Chuuk (Federated States of Micronesia) | 2021 | 2016 version | English | ||
Colombia | 2019 | 2016 version | Spanish | ||
Costa Rica | 2014 | Pilot version | Spanish | ||
Georgia | 2022 | 2016 version | English | ||
Guam | 2017 | 2016 version | English | ||
Guatemala | 2020 | 2016 version | Spanish | ||
Jamaica | 2017 | 2016 version | English | ||
Cyprus | 2017 | Pilot version | English | ||
New Zealand | 2016 | 3.2 version | English | ||
Fiji | 2020 | 2016 version | English | ||
Palestine | 2016 | Pilot version | English | ||
Nepal | 2015 | Pilot version | English | ||
New Zealand (summary) | 2016 | 3.2 version | English | ||
Norway | 2017 | 2016 version | Norwegian | ||
Costa Rica | 2019 | 2016 version | Spanish | Repeat assessment | |
Sri Lanka | 2018 | 2016 version | English | ||
Peru | 2016 | Pilot version | Spanish |
Key Figures on SAI PMF Implementation
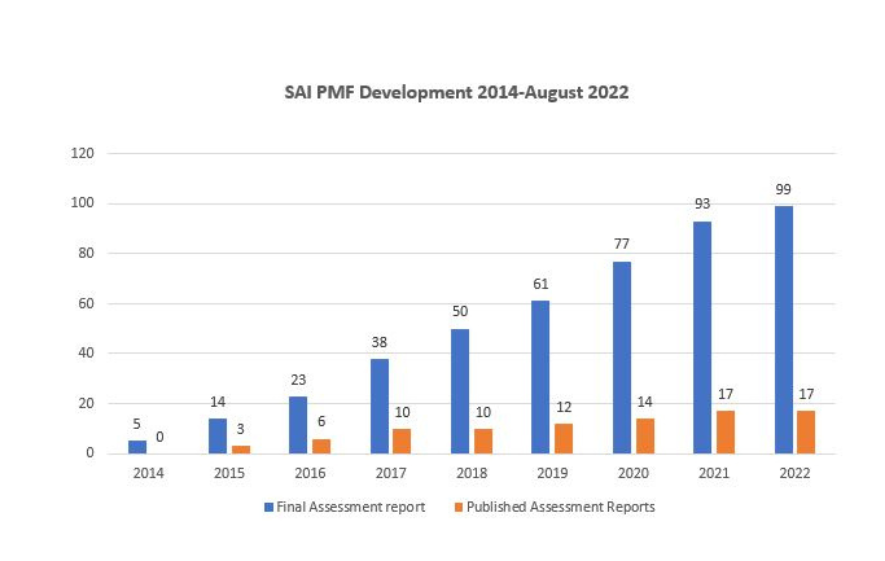
Figure 1: SAI PMF cumulative number of reports per August 2022. This illustrates that 17 reports have been published and 99 reports have been finalised, showing a steady increase since 2014.
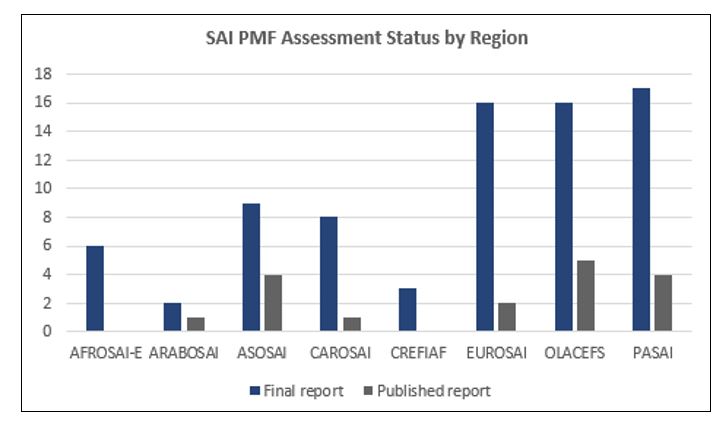
Figure 2: SAI PMF regional implementation per August 2022. This illustrates the strong uptake across the globe. Note that the number of published reports are not included in the number of final reports.
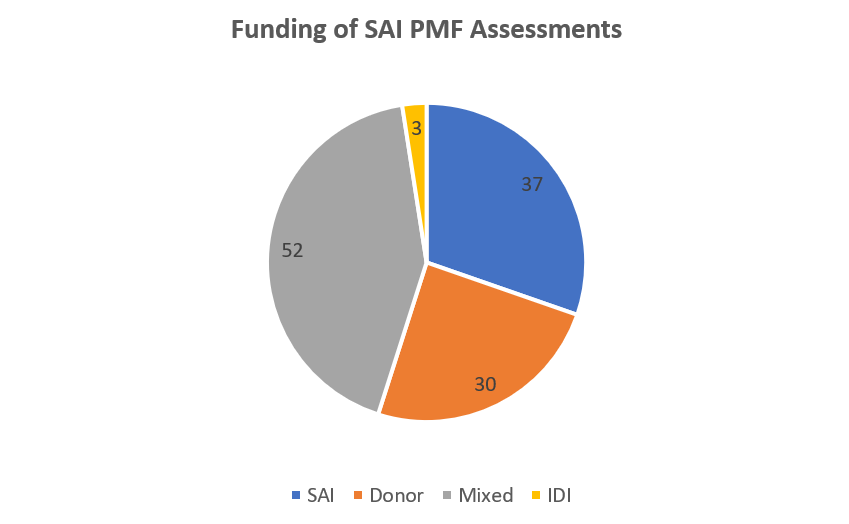
Figure 3: Funding of SAI PMF assessments per 1. September 2020. The figure illustrates the number of assessments that are funded by the SAI, donor, IDI or mixed funding. The numbers include all assessments that are finalized, in execution and where a decision has been made to conduct an assessment.
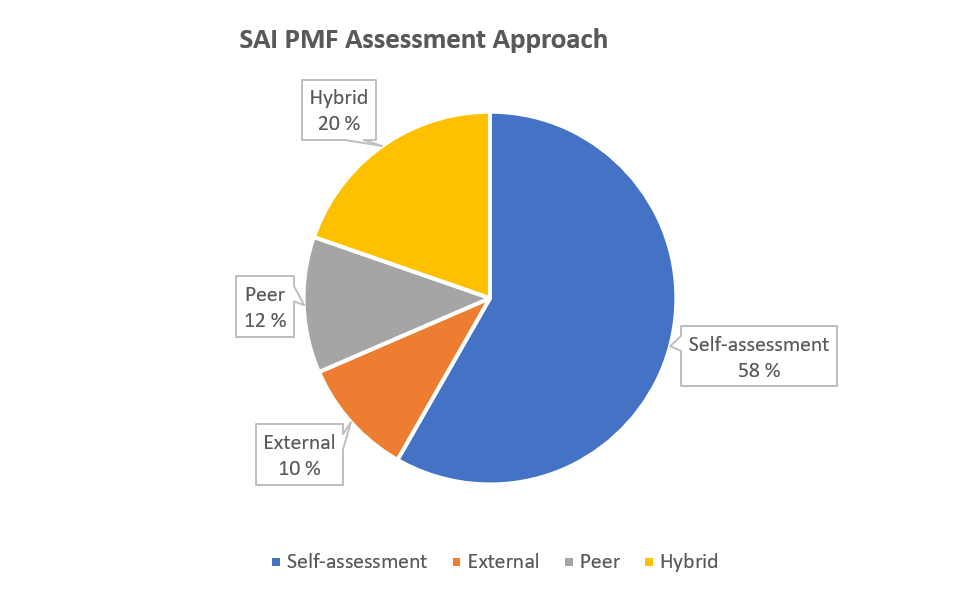
Figure 4: SAI PMF assessment approach per 1. September 2020. The figure illustrates the percentage of assessments that are conducted as a self, peer, external or hybrid approach. Explanation of the assessment approaches: 1) a self-assessment entails that the assessment is being conducted by an internal team within the SAI, 2) a peer-assessment entails that the assessment is being conducted by a peer SAI or an INTOSAI body, 3) an external-assessment entails that the assessment is being conducted by an external team for instance a team of consultants and 4) a hybrid assessment entails that the assessment is being conducted as a mix of the other approaches. The numbers include all assessments that are finalized, in execution and where a decision has been made to conduct an assessment.